This article is one of a five-part series on team capacity planning
This article discusses functionality that is included in the Enterprise+ plan. Please contact us if you would like a live demo or would like to try using it in your account.
Aha! Roadmaps | Team capacity report (Enterprise+)
Complex, multi-team projects do not come with a crystal ball to help you avoid capacity conflicts — but the capacity report comes close. This report aggregates all the estimates you have entered on records and visualizes your teams' workloads — including any scheduled changes to their capacity —according to the planning scenario you select.

Like the individuals capacity report, you can use the teams capacity report to get a sense of how your plan might play out in reality, and resolve capacity conflicts well before they threaten your teams' ability to complete work. Choose a scenario that captures your teams' capacity in time, people, or story points to get a deeper understanding of the level of effort necessary to reach your strategic goals. You can also run the report multiple times to get a sense of multiple capacity scenarios.
If you have not yet configured capacity planning for teams in your Aha! Roadmaps account, we recommend starting with that step.
Click any of the following links to skip ahead:
Enable the capacity report
To use the capacity report, first you need to enable capacity planning in your Aha! account, which can happen one of two ways.
Individual capacity planning is enabled at the workspace level. Workspace owners should navigate to Settings ⚙️ Workspace Capacity planning and check the Enable checkbox.
Team capacity planning is enabled at the account level. Administrators with customization privileges should navigate to Settings ⚙️ Account Capacity planning and check the Enable team planning checkbox.
Enabling either type of capacity planning will enable the capacity report across your account. Users with any Aha! Roadmaps user permission level can open the report by navigating to Roadmaps Capacity.
If you do not see the capacity report in a workspace, you may need to customize your menu navigation.
Configure the capacity report
At the top left of the report, choose the record type you want to examine using the Record type dropdown — initiatives, epics, features, or requirements.
Note: Depending on your workspace type, you may also see "activities" in your workspace instead of "features."
Next, configure the capacity report to match how teams in your company complete work. To make these selections, click the Configure capacity report ⚙️ button at the top of the report.
The Configure capacity report ⚙️ button will not appear if you have selected a scenario that uses People as its Estimation units.
First, Configure planning to select how individuals on your team complete work.
If you select Sequential planning, the report will assume that teams and individual team members work on one item at a time. It starts with the highest priority item and applies one hundred percent of a team's available capacity until the work is complete.
If you select Parallel planning, the report will assume that teams and individual team members work on multiple items at the same time. It starts with the highest priority item and allocates the necessary daily capacity to complete the item by its Due date. It then distributes any unallocated daily capacity to the next item(s) in the list.
Next, Configure estimate to match how you estimate effort.
Best (default) prioritizes the Detailed estimate, if available.
Initial only uses the Initial estimate exclusively.
Detailed only uses the Detailed estimate exclusively.
If you are using a named ranges planning scenario, you will see an additional option to Configure risk tolerance. Use this setting to explore different delivery scenarios:
Conservative: Assume that work takes more time to complete
Moderate: Assume that work takes a typical amount of time to complete
Aggressive: Assume that work takes less time to complete
Click Save to save your changes. The changes you make to this modal do not affect the records themselves, or any other Aha! user's view of the capacity report.
To appear on the capacity report, a record needs either Start and Due dates or an effort estimate.
Finally, use the filters at the top of the report to focus it to the exact Scenario, Workspace, Team, and, depending on the Record type you select, the Release settings or Initiative timeframes you want. You can switch between scenarios to view different implementations of your plan.
When you save a report, the filters save as well — and this is important in the case of scenario configurations. If you share a saved capacity report with another Aha! user, the report will show information for the Scenario you have selected, regardless of their active scenario configuration. This way, you can collaborate on the same data.
Note: Depending on your workspace type, you may also refer to the Release settings filter as the Schedule settings filter.
You can also add filters to your report. If you want to add a quick basic filter, hover over the filters bar and click the Add filters + icon. If you want to add advanced filters, click the Edit filters icon.
Orientation
Let's start by orienting you with the report itself.
The capacity view
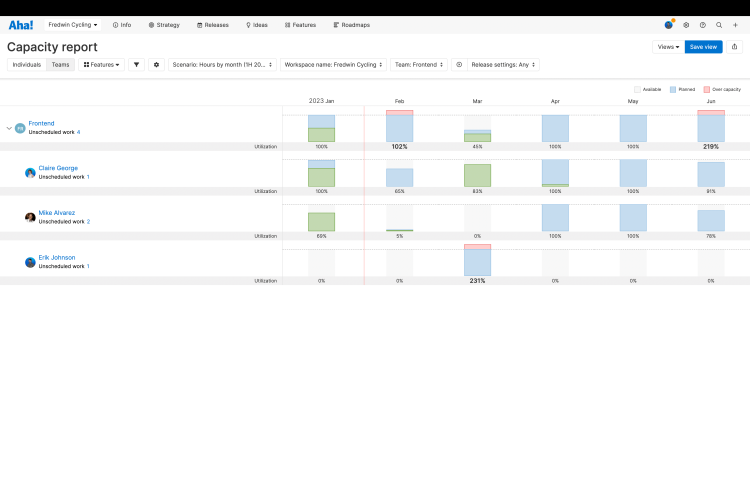
The report will start on the capacity view — the view that shows you your teams' and team members' capacity by team and by month, along with any work logged in the Actual effort field. Since we are focusing on team planning in this article, click the Teams toggle in the upper left if it is not already selected.

You will see a few different colors in the capacity view.
Grey shows that a month or part of a month is available — that the team or individual has untapped capacity that month.
Blue shows that a month or part of a month has planned work in it — that is, records assigned to that team or individual whose Start dates fall in that month.
Green shows that a month or part of a month has completed work in it — records that were assigned, scheduled, and completed.
Red shows that a team or individual is overcapacity in a given month. They either have more work than they can be expected to complete in the month or they have records whose Start dates, Due dates, or Estimates conflict with each other.
The timeline view
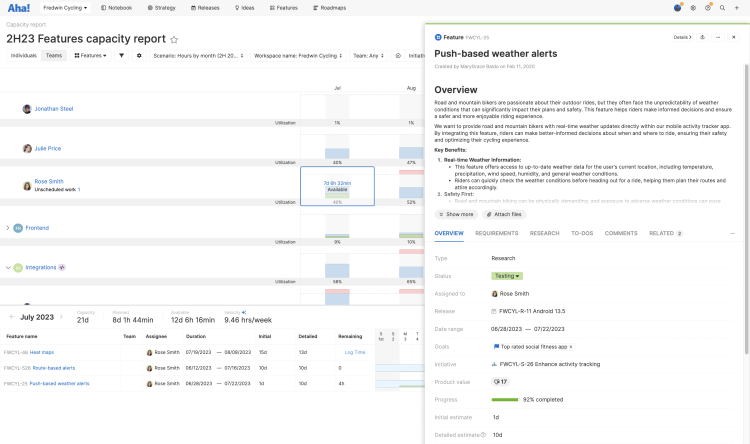
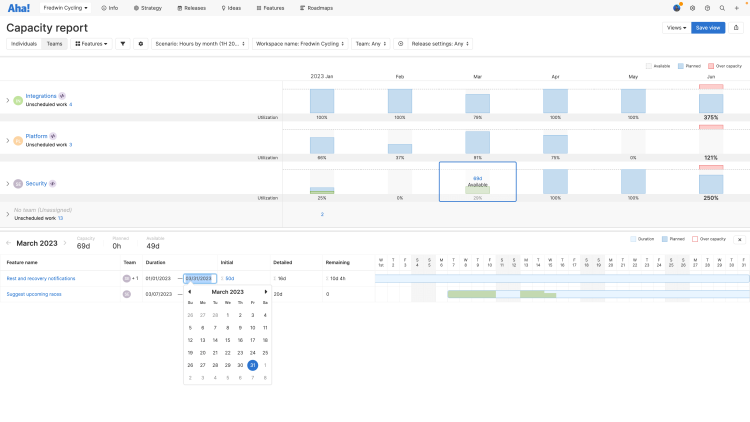
Click on a month to move In the timeline view, where you can see a top-level summary of the month — the total Capacity for a team or for an individual team member, the total Planned work, and any Available capacity, in time, people, or story points.

If you have integrated Aha! Roadmaps and Aha! Develop in your account and linked actual Aha! Develop teams to your capacity planning teams, you will also see those teams' Velocity in this view. As teams complete sprints, their Velocity will update automatically on this report and in their work schedule.
You can manually adjust a team's Velocity in their work schedule for the current month, but it will revert to an automatic calculation whenever that team next completes a sprint.
If you click on a month in the past, the timeline view will display a team's velocity based on work they completed that month.
If you click on a current or future month, the timeline view will display a team's velocity based on their last three completed sprints.
Click on Velocity to move to the Aha! Develop velocity report and examine details.
You will also see a list of records with estimates that involve a given team or team member, along with scheduling information about them — the Team(s) scheduled to work on the record, the estimated Duration dates for the work, and capacity Estimates (in time, people, or story points). If you have added estimates for individual team members, the Team column will list them as well.
Since it is usually more accurate, the capacity report will use a Detailed estimate, if it is available, to visualize a team's capacity.
Click on the Record name to open the record's drawer view and edit it, or click on any of the scheduling fields to edit those.
Note:
Unlike the individuals capacity report, adjusting an estimate's Duration will not adjust a team's Estimate. This is because multiple teams could be scheduled to work on the same item.
If you are estimating in time and you enter an Estimate that is less than the time between a record's Start date and Due date, the capacity report will assume that work on that record will begin on the Start date — as long as no other higher-ranked records have the same Start date — and end when the Estimate is complete.
If you are estimating in time and you enter an Estimate that is greater than the time between a record's Start date and Due date, the capacity report will still tell you how much extra time or extra people on the team the record needs.
If you are estimating in people, your Estimate will apply to the estimate's entire Duration. So for example, if you think a feature will take one person to complete, and the duration lasts a week, the capacity report will show one person allocated to that feature for the entire week.
If multiple teams or team members are part of one record's Estimate, the capacity report will show an icon for your currently selected team, then a number, e.g. "DT + 1." That number respects filters you have added to your capacity report: it is the number of additional teams included in the capacity estimate that can be shown on the report. Click into the Team field in the timeline view if you want to see all teams and team members associated with the estimate.
If you are estimating in story points, remember your available capacity is determined by your team's schedule. The schedule determines how many points your team can accomplish per day.
The timeline view shows you every day in your selected month and how your scheduled capacity estimates will play out throughout the month. You can hover over each day in the month to see how much work is planned for a given record on that day.
The timeline view also includes colors that are similar to those you saw in the capacity view:
Light blue shows when a record is scheduled but when no work is planned. Weekends, for example, will be this color.
Blue shows when work is planned on a record.
A red border around a scheduled record shows that it is in conflict — either with another record or because there is not enough time or people available to complete the work planned in the scheduled time.
The teams capacity report follows your Configure capacity report ⚙️ selection.
The Configure capacity report ⚙️ button will not appear if you have selected a scenario that uses People as its Estimate units.
If you have chosen Sequential planning, the report will assume that teams or team members will have only one work item in progress at any given time.
If you have chosen Parallel planning, the report will assume that teams' and team members' capacity will be divided among work items with overlapping durations, based on their priority (their rank order on the Strategy Initiatives or Features Board pages).
The report will also respect your estimate selection: Best available estimate (default), Initial only, or Detailed only.
The timeline view for people-based estimates
The capacity report can visualize your teams' and team members' capacity in four ways: by the amount of time, money, story points, or the number of people you estimate the work will take to complete. If this is your first time using people-based estimates, it is worth taking a walkthrough of the timeline view and some of the insights it can provide you.
People estimates always fill an estimate's duration
People estimates work a little differently than time-based estimates. You might estimate that an epic will take 100 hours' work over the next six months, for example, and the capacity report will look at your teams' work schedule and deduct 100 hours from their available capacity. From a people perspective, though, you are not estimating capacity in terms of time. If you estimate that an epic will need three developers on your team to complete by its Due date, the capacity report will deduct three people from your team's available capacity and assume that those team members are working full time towards completing the epic.
Both ways of estimating capacity are useful — and you are welcome to create multiple scenarios to estimate capacity both ways. People-based estimates focus on a percentage of your team, which can be useful for higher-level planning. For example, you might not need to know the hourly estimates of each individual feature that contributes to an epic to know that you want half of your team focused on it for the next six months.
People estimates use the team's work schedule
Each team has a work schedule assigned to it, configuring the working days in a week and any non-working days in a given year. When you add people to a team, you can give individual users their own work schedules (for example, taking into account a team member in another country who has different national holidays). When you select an active scenario that uses people estimates, the capacity report will only look at the teams' work schedules.
This is by design. People estimates on the capacity report are not about scheduling specific individual people; they are about estimating the number of people on your team you will need to allocate towards a given project at a high level.
Monthly capacity can include fractions of people
It makes sense that a monthly capacity could include fractions of an hour, but it can be harder to understand fractions of a person. If your active scenario configuration estimates in people and Team or Team by time, then the Timeline view of a month can include fractions of people for Planned or Available capacity. Let's look at a simplified example:

In this example, February has 20 working days, the team has one person on it, and the initiative is estimated (for argument's sake) to take one person one day to complete. The full team (one person) working one day out of the 20 available that month takes 10% of the team's capacity for the month. If we increased the initiative's length to 10 days — the full team (one person) working half the days available that month — we would see that that team has 50% capacity planned and 50% capacity available.
This is the basic logic of the report: the number of people available and the number of working days allocated to those people helps the report calculate each team's capacity. Where this gets more sophisticated is when you have multiple overlapping records and some days when your team is not fully allocated. Obviously you cannot have fractions of an actual person allocated to different projects, but you can have a person allocated to a different project on different working days in a given month.
Set a default capacity report
The best saved views drive consistency across your team — or your entire organization. Workspace owners can set default views at the workspace or workspace line levels, so that everyone is using the agreed upon standard. To set defaults more broadly, you can set them at the workspace line level, so that child workspaces can inherit the defaults.
To set a default view, first Save one. Then navigate to Settings ⚙️ Workspace Default views and configure your new default.
A user will see your default view if they do not already have a working copy of a view on that page, or if they click Views Reset to default view.
If you update your default view and Save it again, that update will be reflected for anyone who views the default.
Share your capacity report
Once your capacity report is ready, click Save to name it, save it, and adjust viewing permissions. Saving a report will save the scenario you selected in the Scenario filter, so everyone who views your report will see the same data.
You can share your capacity report with your stakeholders by selecting one of the export options under the Share menu on the top right of the page.
To fold your report into a presentation, select Add to presentation. In your presentation, you can select the report's update frequency.
To invite people outside of your Aha! Roadmaps account to view your report, select Share as webpage.
To schedule recurring email delivery of your report, select Schedule email delivery.
For a static version of your report, export it to PNG image or PDF document.
If you get stuck, please reach out to our Customer Success team. Our team is made up entirely of product experts and responds fast.